
Ascending Triangle
An ascending triangle is a bullish chart pattern formed by a flat resistance line and a rising support line, suggesting growing buying pressure.
Descending Triangle
A descending triangle is a bearish chart pattern where the support line is flat and the resistance line slopes downward, indicating increasing selling pressure.
Symmetrical Triangle
A symmetrical triangle is a neutral pattern formed by converging trendlines. It signals price consolidation and a potential breakout in either direction.
How to Trade Triangle Patterns Effectively
Triangle patterns are among the most reliable formations in technical analysis. Whether you’re trading stocks,
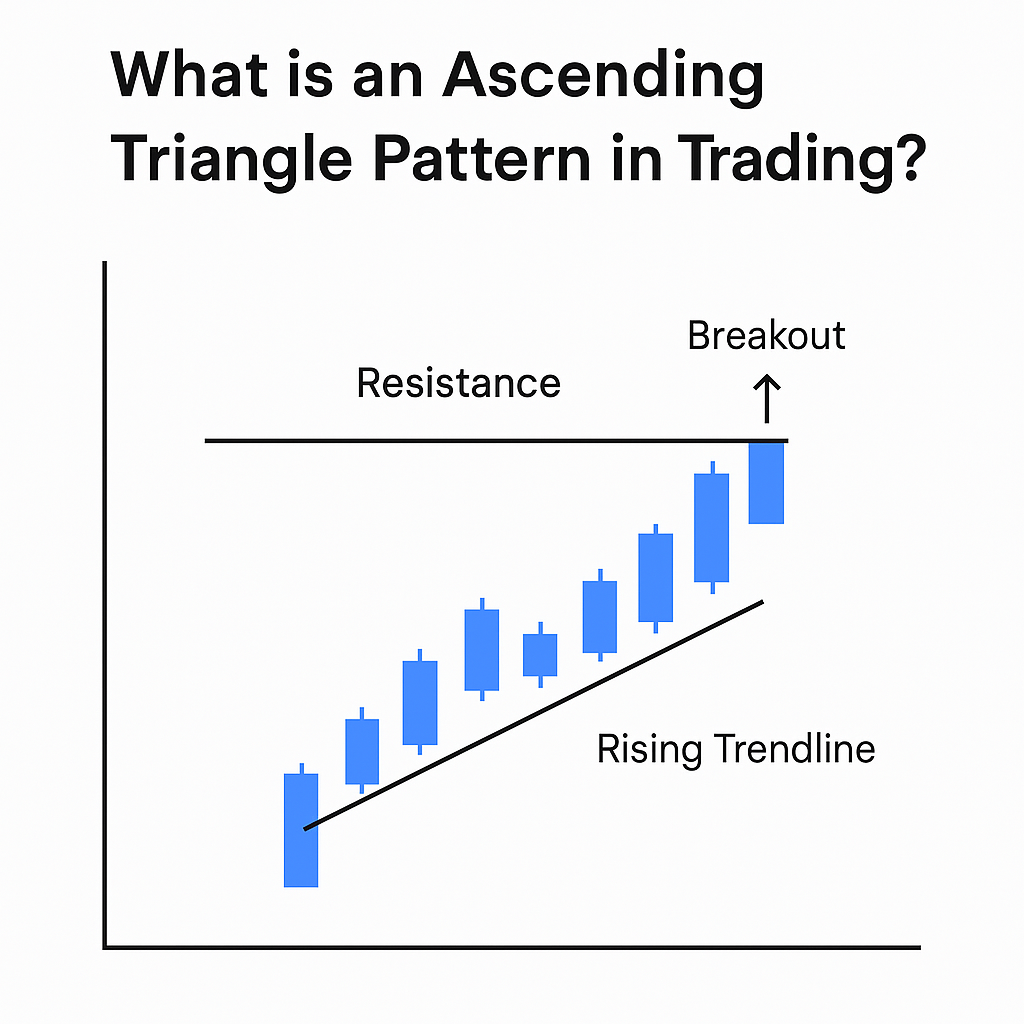
What is an Ascending Triangle Pattern in Trading?
An ascending triangle pattern is a bullish continuation pattern that appears during an uptrend. It
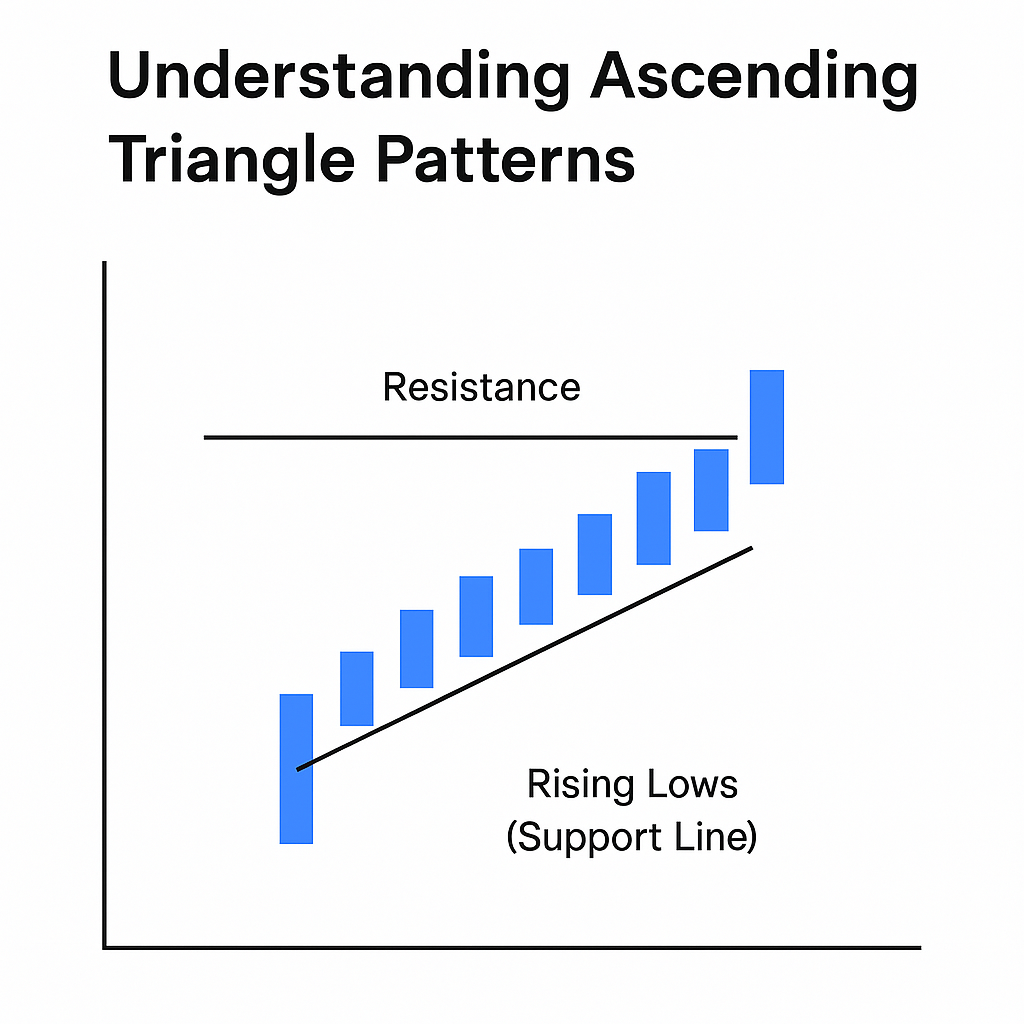
Understanding Ascending Triangle Patterns
Ascending triangle patterns are powerful indicators of potential bullish breakouts in technical analysis. Commonly seen
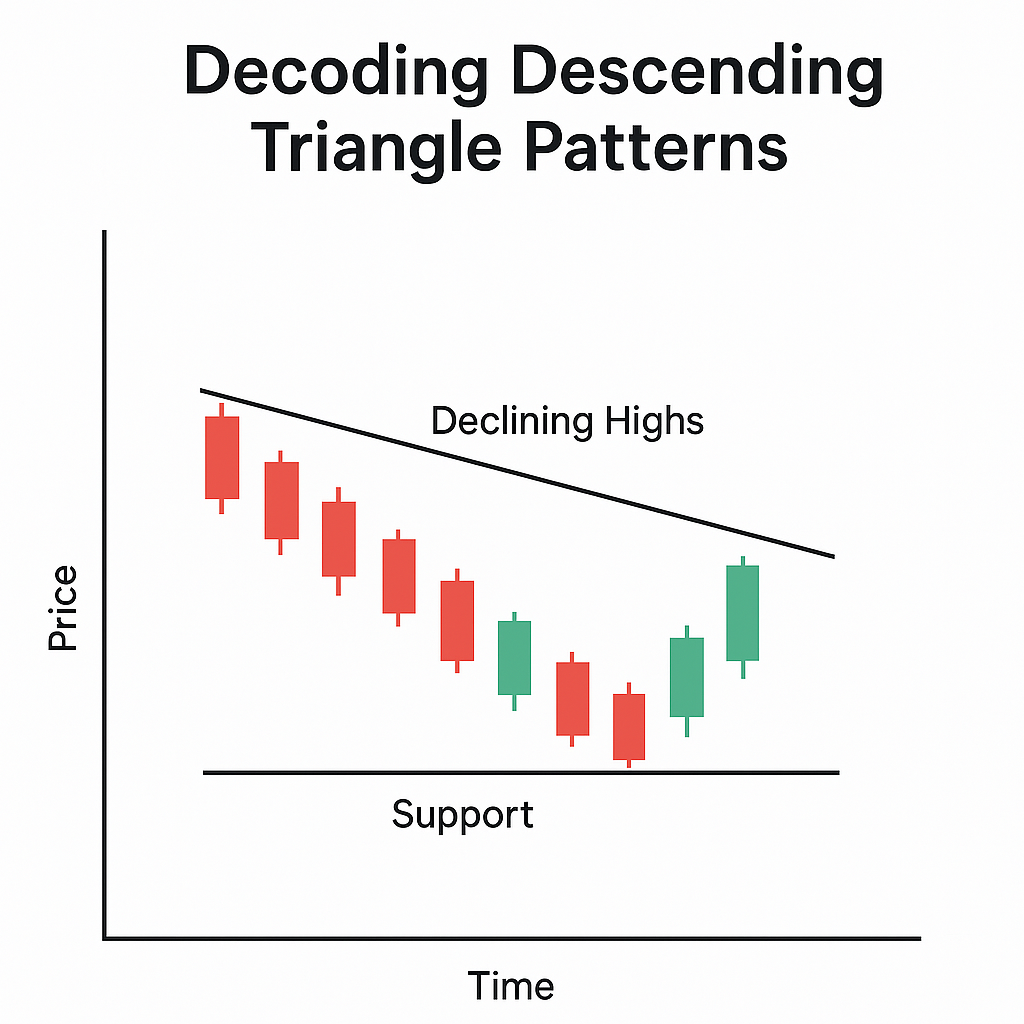
Decoding Descending Triangle Patterns
In the world of technical analysis, triangle patterns play a vital role in identifying potential

James Traxler
CEO & Founder

Sherri Woodard
Content Writer

John Lewis
Designer

Susan Collins
Reporter