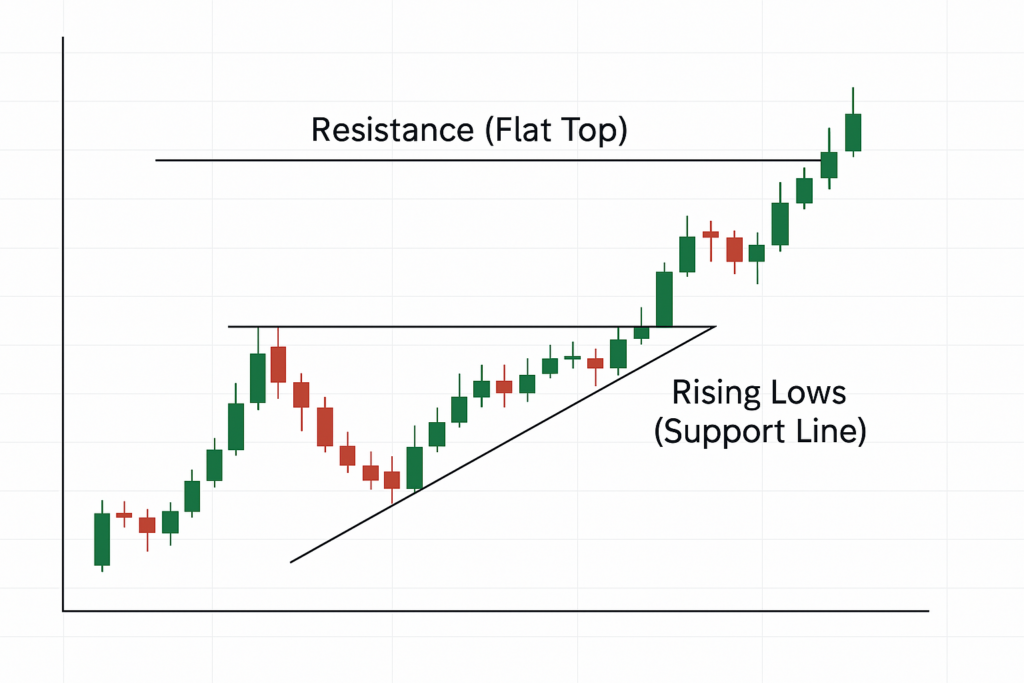
An ascending triangle pattern is a bullish continuation pattern that appears during an uptrend. It forms when the price creates a series of higher lows, but keeps hitting a flat resistance level. This builds pressure beneath the surface, often resulting in a breakout above resistance.
Key Features of an Ascending Triangle
- Flat Top (Resistance): Price hits the same high multiple times.
- Rising Trendline (Support): Each low is higher than the previous one.
- Volume Contraction: Volume tends to decrease as the triangle forms.
- Bullish Breakout: Most patterns end with an upward breakout.
Why Does It Happen?
The ascending triangle reflects growing buyer strength. Each dip gets shallower as more traders step in early, while sellers continue to resist at a fixed price. Eventually, buyers overpower sellers, pushing the price above the resistance line.
Chart Example

How Traders Use It
- Identify the Pattern: Look for at least two equal highs and two higher lows.
- Wait for a Breakout: Enter after a strong close above resistance.
- Set a Stop-Loss: Below the rising support line or previous swing low.
- Project a Target: Measure the height of the triangle and add it to the breakout level.
Real-World Example
- Asset: ABC stock
- Resistance: $150
- Rising Lows: $140 → $144 → $147
- Breakout: $151 with strong volume
- Target: $161 (based on $11 triangle height)
🎯 Result: Price reached target in 4 trading sessions.
Pros of the Ascending Triangle Pattern
✅ Easy to recognize
✅ High probability of bullish breakouts
✅ Works well in trending markets
✅ Clear structure for risk/reward planning
FAQs
1. Is an ascending triangle always bullish?
Yes, it typically signals a bullish breakout, especially when formed during an uptrend.
2. What markets show ascending triangles?
They appear in stocks, forex, crypto, commodities—any market with sufficient liquidity.
3. Can I use indicators with this pattern?
Yes! RSI, MACD, and volume can add more confirmation.
4. How accurate is the pattern?
It has a high success rate when accompanied by volume and broader trend support.
5. Does it work on all timeframes?
Yes, but daily and 4-hour charts are often more reliable than lower timeframes.