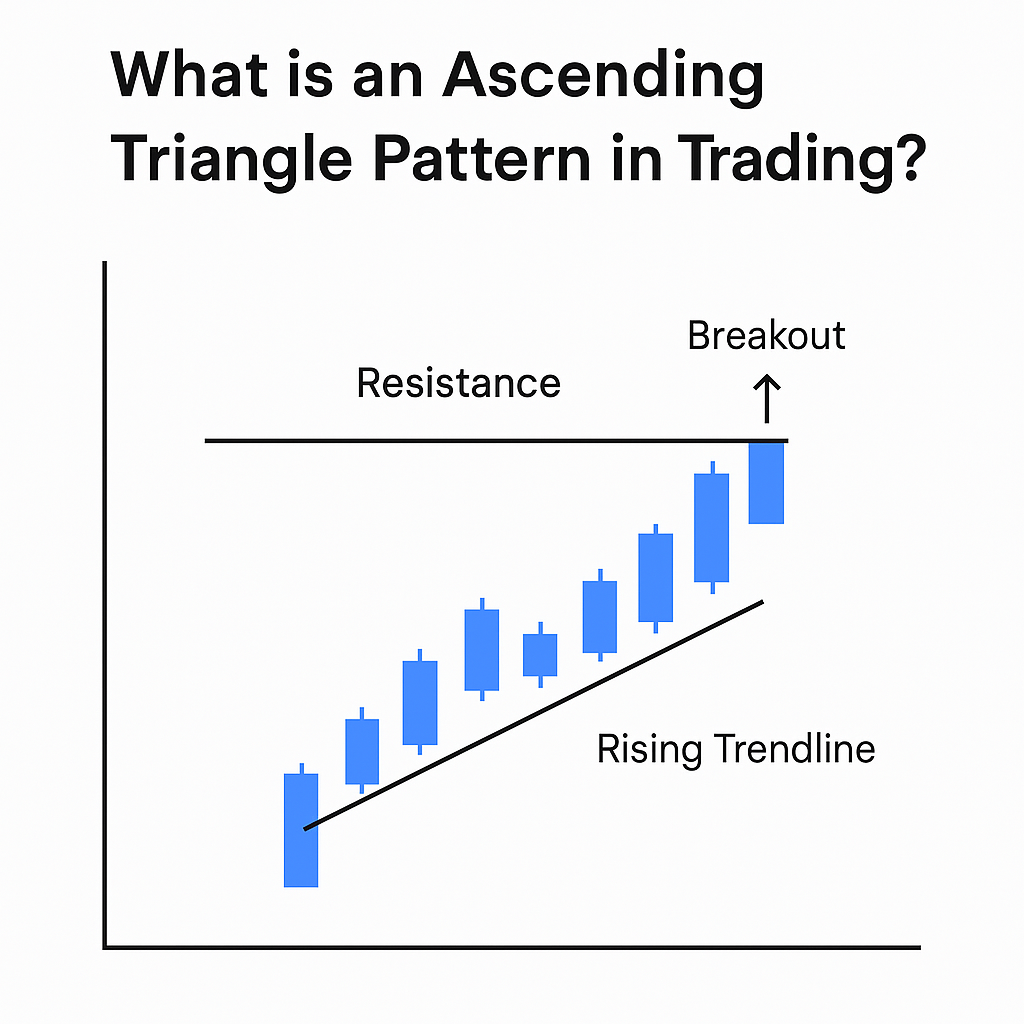
What is an Ascending Triangle Pattern in Trading?

An ascending triangle pattern is a bullish continuation pattern that appears during an uptrend. It forms when the price creates a series of higher lows, but keeps hitting a flat resistance level. This builds pressure beneath the surface, often resulting in a breakout above resistance. Key Features of an Ascending Triangle Why Does It Happen? […]
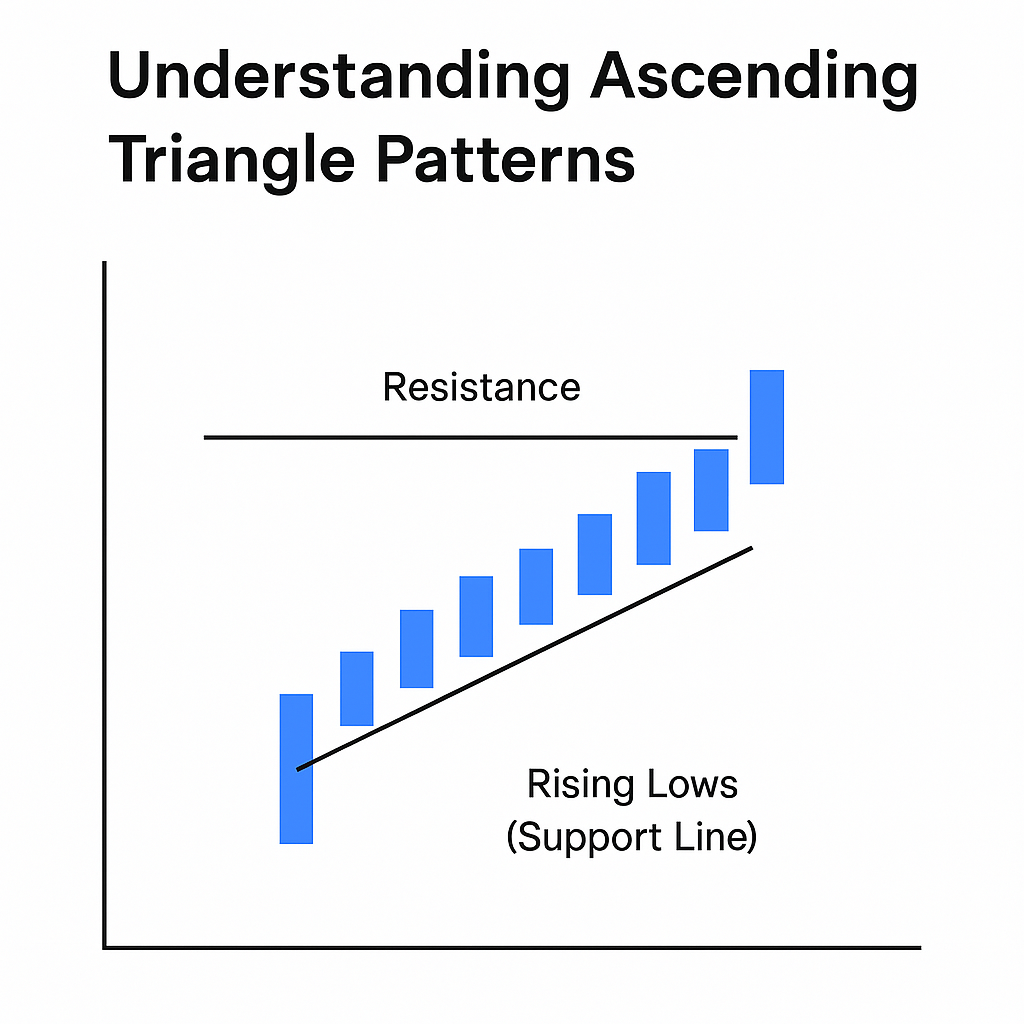
Understanding Ascending Triangle Patterns

Ascending triangle patterns are powerful indicators of potential bullish breakouts in technical analysis. Commonly seen in trending markets, this pattern forms when buying pressure gradually overcomes resistance. In this guide, you’ll learn how to identify, interpret, and trade ascending triangles like a pro. What Is an Ascending Triangle Pattern? An ascending triangle is a bullish […]
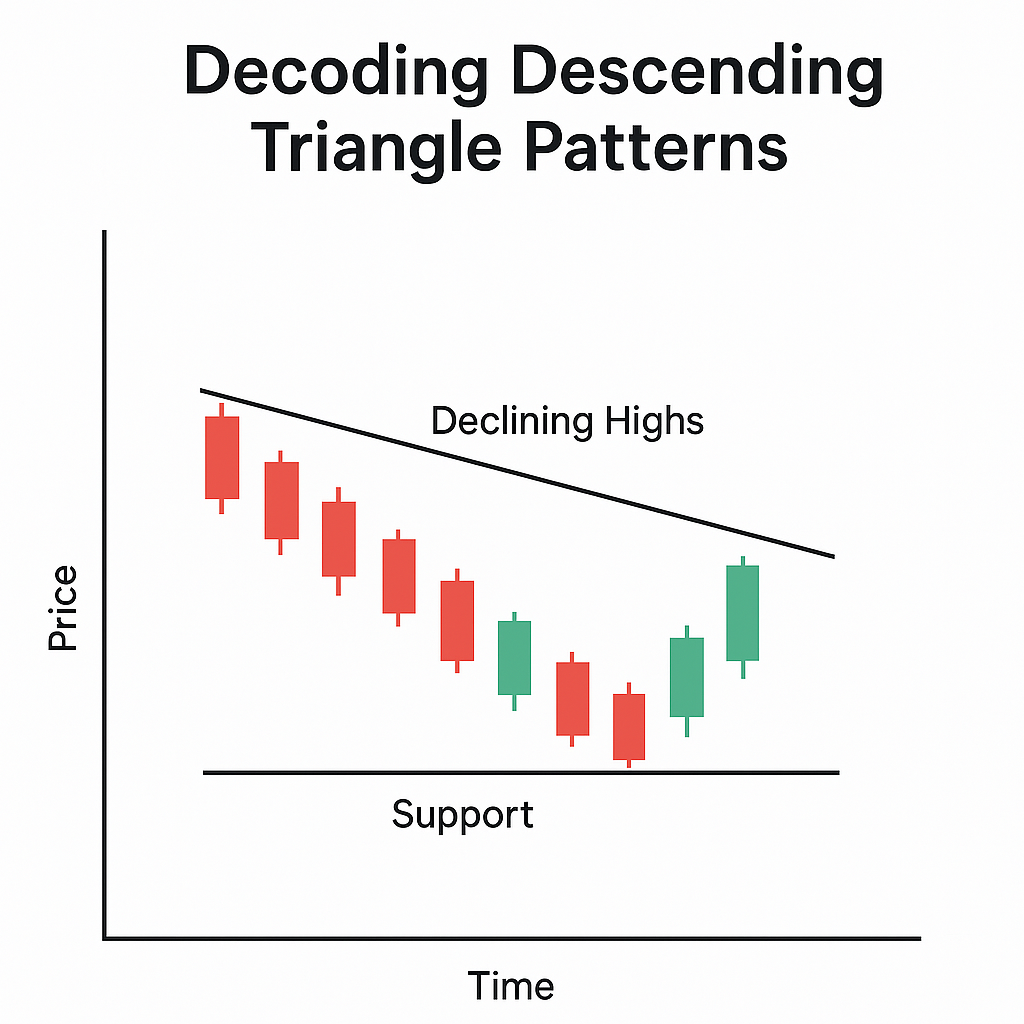
Decoding Descending Triangle Patterns

In the world of technical analysis, triangle patterns play a vital role in identifying potential breakouts. Among them, the descending triangle pattern is widely recognized as a bearish continuation pattern that can signal upcoming price breakdowns. This guide will help you decode descending triangle patterns and use them effectively in your trading strategy. What Is […]
Symmetrical Triangle Patterns: A Comprehensive Guide
In technical analysis, triangle patterns are vital tools for predicting price movement, and among them, symmetrical triangle patterns are some of the most commonly seen. These patterns signal a potential breakout but leave the direction open, making them both versatile and powerful. This guide will cover everything you need to know about symmetrical triangles—from identification […]
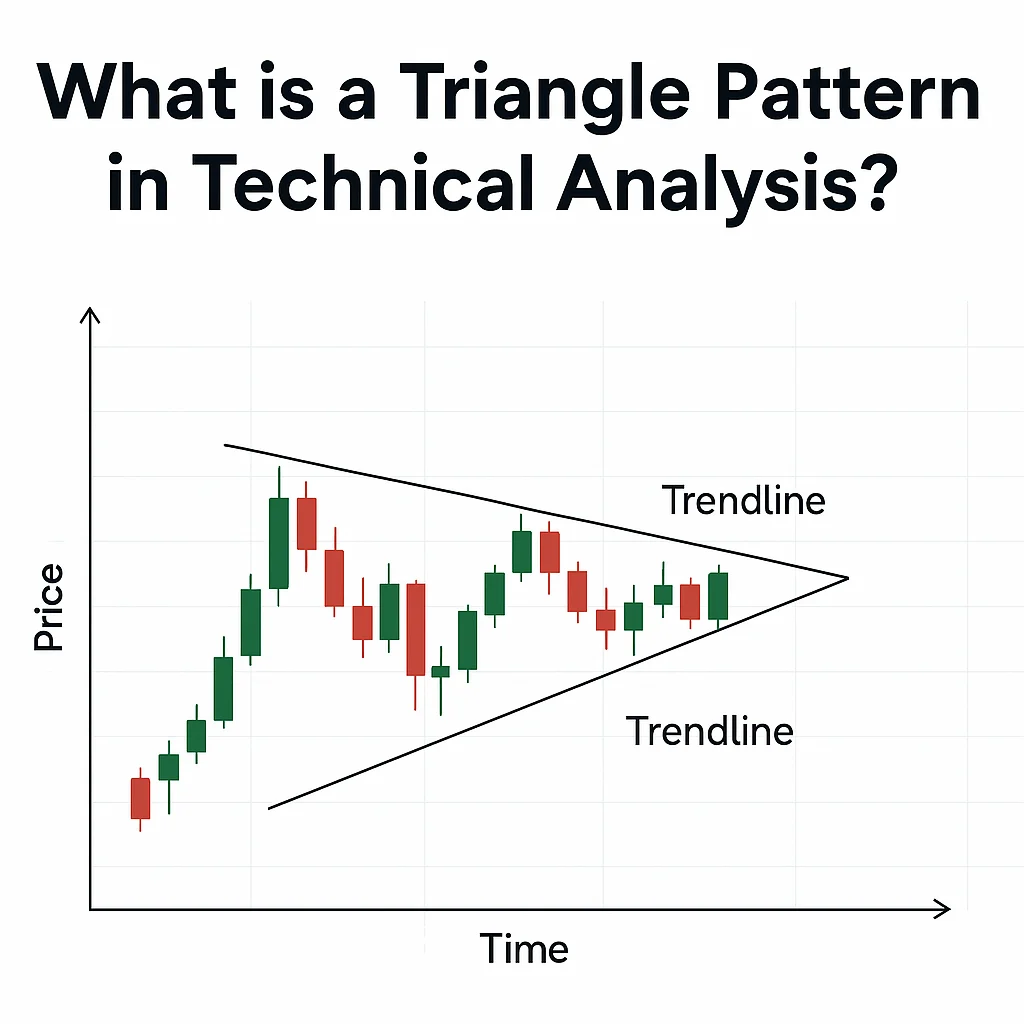
What is a Triangle Pattern in Technical Analysis?

Introduction Technical analysis is a cornerstone of trading, helping investors predict future price movements by studying historical charts. Among the many chart patterns traders rely on, triangle patterns stand out as powerful indicators of market consolidation and potential breakouts. These patterns form when an asset’s price range narrows, creating a triangle shape with converging trendlines, […]