In the world of technical analysis, triangle patterns play a vital role in identifying potential breakouts. Among them, the descending triangle pattern is widely recognized as a bearish continuation pattern that can signal upcoming price breakdowns. This guide will help you decode descending triangle patterns and use them effectively in your trading strategy.
What Is a Descending Triangle Pattern?
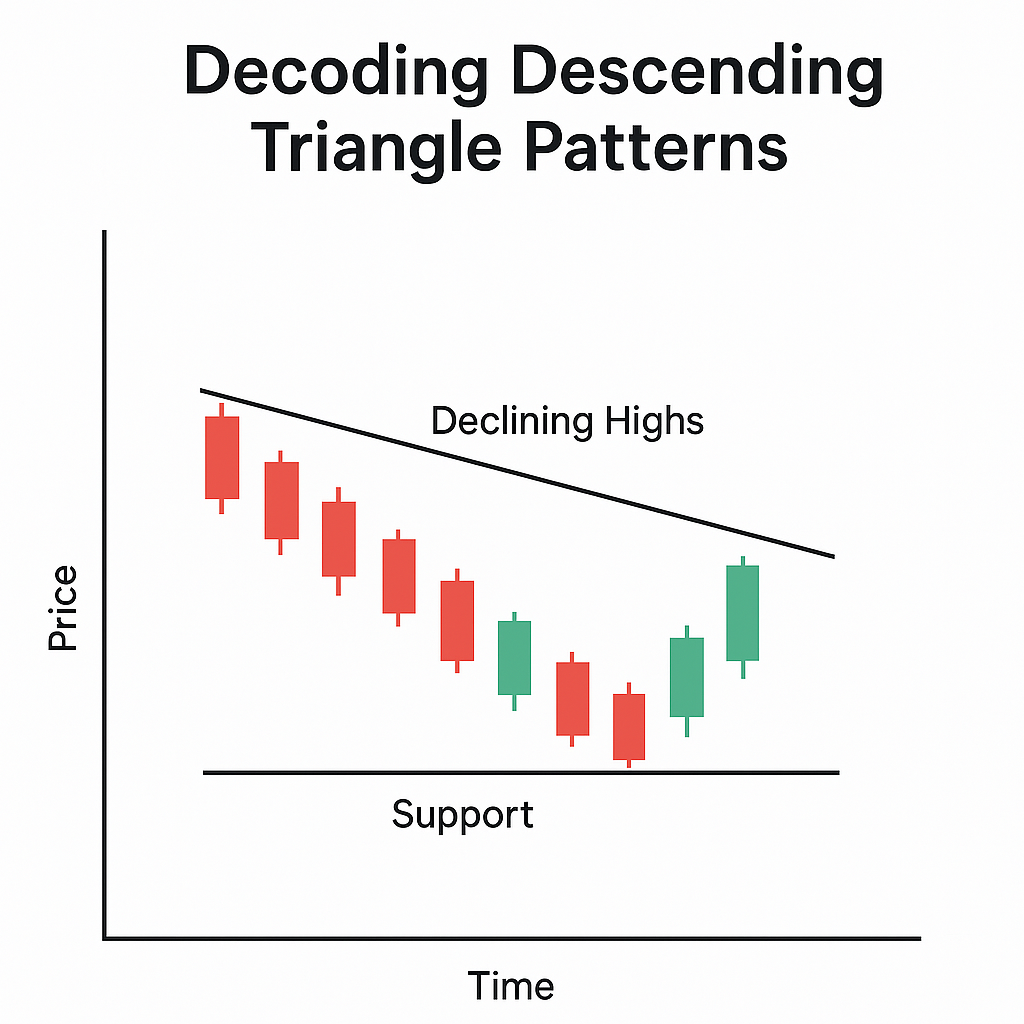
A descending triangle forms when:
- The lower trendline is flat (acting as a support level)
- The upper trendline is sloping downward (showing lower highs)
This pattern suggests sellers are becoming more aggressive, consistently pushing prices lower, while buyers are struggling to hold a specific support level.
📉 It usually ends with a bearish breakout below the support line.
Key Characteristics of Descending Triangles
✅ Flat support line
✅ Series of lower highs
✅ Decreasing volume during pattern formation
✅ Breakout to the downside (in most cases)
Illustration of a descending triangle pattern.
How to Trade Descending Triangle Patterns
1. Identify the Pattern
- Look for a horizontal support line and descending resistance line.
- Ensure there are at least two touches on both lines.
2. Wait for the Breakdown
- Enter short when the price closes below the support level.
- Avoid guessing the breakout direction—wait for confirmation.
3. Confirm with Volume
- Volume should drop during the formation and spike on the breakout.
4. Set a Stop-Loss
- Place the stop-loss just above the last lower high or upper trendline.
5. Set Your Profit Target
- Measure the height of the triangle and subtract it from the breakout level to estimate the target.
Example Trade Setup
- Asset: BTC/USD
- Support Level: $28,000
- Lower Highs: Formed from $30,500 to $28,500
- Breakdown Point: $28,000
- Target: $26,000 (based on $2,000 triangle height)
- Volume: High on breakdown day
📌 Result: Price dropped sharply to $25,900 in 2 days.
Why Descending Triangles Matter
- Bearish Bias: Indicates downward pressure and weak buyer momentum
- High Probability: Breakdowns are frequent and can lead to significant moves
- Clear Setup: Ideal for disciplined traders with predefined risk/reward
Common Mistakes to Avoid
❌ Entering without confirmation
❌ Ignoring volume (fakeouts can happen!)
❌ Placing stop-loss too tight
❌ Trading small patterns on noisy timeframes (like 1-min charts)
FAQs
1. Is the descending triangle always bearish?
Usually, yes. But occasionally, breakouts can go upward—always wait for confirmation.
2. Can I trade descending triangles in crypto?
Absolutely. Crypto markets often show clear descending triangle setups due to volatility.
3. How accurate is the descending triangle pattern?
Historically, descending triangles have a high success rate when confirmed with volume.
4. What timeframes work best for descending triangles?
Daily and 4-hour charts are most reliable, but intraday traders use them too.
5. Can descending triangles be part of a larger pattern?
Yes, they often appear within bigger consolidation structures or trend setups.